By Nicky Alushi, Environmental Monitoring Business Development Manager, Smart Monitoring
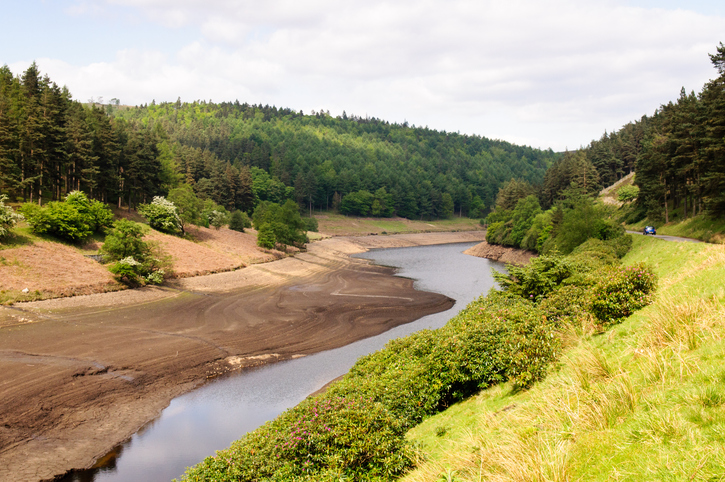
The summer of 2026 has brought exceptionally dry conditions across England and Wales. In July, parts of southern England received just a fraction of their usual rainfall, with provisional Met Office figures recording the driest July on record for England and Wales.[1]
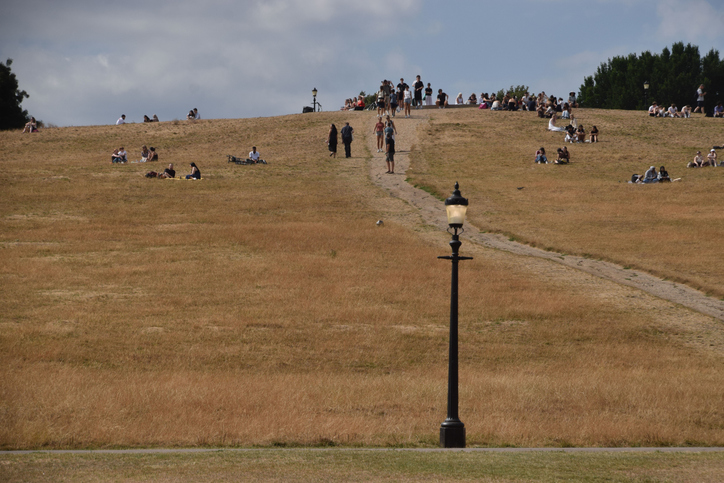
The immediate impacts of drought are easy to recognise: pressure on water resources, stressed landscapes, low river levels and increasingly dry ground.
But there is another consequence that is particularly important for environmental monitoring.
What happens when the environmental baseline itself begins to change?
Environmental monitoring relies on understanding what ‘normal’ looks like so that unusual changes, exceedances and potential impacts can be identified. During prolonged periods of extreme weather, however, those normal background conditions can shift considerably.
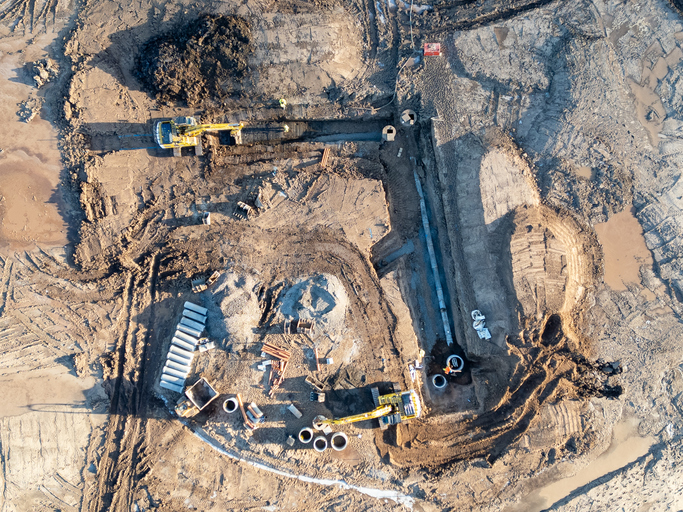
That matters when monitoring air quality, water quality, ground movement and the environmental impacts of construction and infrastructure activity.
A baseline isn’t always fixed
A baseline is generally established using measurements taken before an activity begins or through historical datasets. It gives monitoring teams a reference against which subsequent changes can be assessed.
In reality, however, the environment is rarely static.
Rainfall, temperature, river flow, soil moisture and seasonal conditions all influence the measurements we collect. Research into environmental baselines increasingly recognises that they are better understood as a range of expected conditions rather than one fixed state.[2]
During a prolonged drought, that range can change much more dramatically.
The challenge is then determining whether a change in monitoring data has been caused by the activity being monitored, the unusual environmental conditions surrounding it, or a combination of both.
Dry conditions can change air quality readings
Airborne particulate matter, including PM₁₀ and PM₂.₅, provides a good example.
Following prolonged dry weather, dust and fine material that might ordinarily remain bound to damp roads, soil or exposed surfaces becomes much easier to disturb.
Vehicle movements, construction machinery and wind can all lift this material back into the air. Research into road dust has shown that moisture on a surface can significantly reduce this process compared with dry conditions.[3]
It means the same level of site activity can potentially produce very different particulate readings depending on the weather and ground conditions that came before it.
For monitoring teams, this context is important. A rise in particulate concentrations does not exist in isolation; understanding surface conditions, rainfall and other meteorological data can help explain what is driving the change.
Low river levels change the picture too
Drought also changes how pollutants behave within rivers and other water systems.
Lower river flows mean less water is available to dilute pollutants. At the same time, warmer water holds less dissolved oxygen, while slower-moving water experiences less turbulence to help replenish it.[4]
The result is that the same pollutant load can produce different measured concentrations and potentially different ecological effects depending on the condition of the river.
This is why monitoring during drought needs to consider more than the concentration recorded at an individual monitoring point.
The Environment Agency recognises this within its drought-management approach, with additional hydrometric, ecological and water-quality monitoring undertaken during drought conditions where appropriate.[4,5]
Understanding river flow, temperature and wider hydrological conditions alongside water-quality measurements provides a much clearer picture of what the data is actually telling us.
Drought can also move the ground
The effects extend beyond air and water.
In areas with clay-rich soils, prolonged dry weather can cause the ground to contract as moisture is lost. When moisture returns, it can expand again.
This shrink–swell behaviour is a recognised UK geohazard and is particularly relevant in London and the South East, where clay formations are widespread.[6]
For infrastructure and construction monitoring, that creates another challenge.
If movement is detected, how much is associated with construction activity and how much is the result of seasonal or prolonged ground drying?
There may not always be a simple answer.
Bringing together ground movement measurements with rainfall, soil moisture, temperature and construction timelines can help build a much stronger understanding of what is happening and why.
Monitoring needs context
Modern environmental monitoring increasingly provides continuous streams of information rather than occasional snapshots.
That gives us far greater visibility of change, but it also makes understanding the context behind that change increasingly important.
Rather than relying solely on a historical baseline, monitoring programmes can use recent environmental history and supporting datasets to understand what would reasonably be expected under current conditions.
Approaches such as rolling baselines and meteorological normalisation can help distinguish weather-related variation from changes associated with operational activity.[2,7]
The key is not simply collecting more data. It is connecting the right data.
Air-quality readings become more meaningful when considered alongside rainfall, wind and surface conditions. Water-quality measurements benefit from river-flow and temperature data. Ground movement can be better understood alongside soil moisture and weather patterns.
What the 2026 drought can teach us
The 2026 drought provides a valuable reminder that environmental measurements cannot be separated from the physical conditions in which they are collected.
An exceedance or unexpected movement still matters, but interpreting it reliably requires understanding what was happening in the wider environment at the time.
As extreme weather becomes an increasingly important consideration for infrastructure, construction and environmental management, monitoring strategies need to be capable of responding to changing conditions.
The baseline may move.
The challenge for environmental monitoring is making sure our interpretation moves with it.
References
[1] Met Office (2026). Historic July sees record dryness, unprecedented sunshine and exceptional warmth. 3 August 2026.
[2] Linder, H.L., Horne, J.K. & Ward, E.J. (2017). “Modeling baseline conditions of ecological indicators: Marine renewable energy environmental monitoring.” Ecological Indicators, 83, 178–191.
[3] Fussell, J.C., Franklin, M., Green, D.C. et al. (2022). “A Review of Road Traffic-Derived Non-Exhaust Particles: Emissions, Physicochemical Characteristics, Health Risks, and Mitigation Measures.” Environmental Science & Technology, 56(11), 6813–6835.
[4] Environment Agency (2023; updated 2025). Review of the research and scientific understanding of drought. Chief Scientist’s Group, Environment Agency.
[5] Environment Agency (2026). Drought: how it is managed in England.
[6] British Geological Survey (2026). Latest research emphasises climate-related subsidence risk to millions of British homes. 11 June 2026.
[7] Grange, S.K. & Carslaw, D.C. (2019). “Using meteorological normalisation to detect interventions in air quality time series.” Science of the Total Environment, 653, 578–588.